
Using a rental property calculator is a tempting way to calculate the potential return a residential real estate investment could provide. Enter the expected rent, key in the price of the property, enter some financing details and you can quickly estimate your ROI. But what if you want to fine tune your strategy? What if you want to account for repairs and improvements, or model different financing scenarios, or compare the cap rates across several properties in one neighborhood?
Padvest research is an in-depth way to evaluate residential real estate investments. Like using a rental property calculator, you can make quick work of analyzing multifamily real estate deals. But with Padvest, you’ll get a comprehensive report showing detailed analysis of the deals you’re considering. Padvest is more than just a calculator – you can replace complicated spreadsheets that are tedious and time-consuming and get essential market data that would be difficult for you to acquire on your own. You can also compare multiple real estate deals quickly, see the projected returns over time, and share the details with your broker or partners. In this article, you will learn why using Padvest is the best way to evaluate residential rental property.
Before we look more closely at how to use Padvest for in depth property research, it’s important that you understand the essential real estate metrics. They are critical to understanding the financial potential of a real estate deal, and you will want to make sure the metrics for a particular property are in line with your investing goals. Here’s a quick refresher of the metrics used on our rental property financial snapshot:
Padvest’s property evaluation report provides much more detail than a rental property calculator. The report designed to analyze residential real estate properties quickly. And it is easy to use – all you need to do is enter the address of the property you want to evaluate. After you answer a few simple questions about the property details, you will immediately get a report with a detailed analysis of the property. Our algorithms pull data from various sources and trusted partners to crunch the numbers using the latest market data available. You can customize key parameters to match your strategy. Let’s continue with a deeper look at the different sections of the report.

At the top of the property evaluation report, you’ll find the financial snapshot. This section shows the critical financial measurements for the property you’re evaluating. As mentioned above, the cap rate, cash-on-cash return, IRR, and CAGR are the key indicators used by long-term residential real estate investors to get an assessment of a property. You’ll want to understand each metric and then consider how it fits your own investing strategy. Investors are striving for the best returns they can get on their investment but be warry of abnormally high numbers - especially as you compare different properties in the same neighborhood. Metrics that are outside of the range in a particular area can be an indicator of higher risk, and a indicate a property that demands further research.

The property evaluation report uses a set of inputs and assumptions to do the calculations and they are shown at the top of the report. You can click the Show All toggle switch to see the complete set of variables used by the report. These inputs and assumptions for each property come pre-populated based on Padvest’s system pulling data from various trusted sources.
If you click any of the Edit links on the report you can customize relevant parameters to fine-tune the property details to match your investing strategy.

You can change the financing details to match the interest rate from your lender. You can customize rent inflation if you are considering a conservative or more aggressive monthly rent strategy. You can adjust the maintenance costs if you think the building will need more maintenance over time. You can also customize variables like the vacancy rates, insurance inflation or the cost of sale. You can fine tune the details to match your strategy so you can be confident in the results.
Long-term real estate investors typically have a primary goal of renting a property for income such that it generates positive cash flow or passive income. This means the property will generate enough income to more than cover the financing and expenses. In simpler terms, positive cash flow is your profit. Cash flow is calculated using operating income minus any repairs and maintenance, operating expenses, and any mortgage payment.
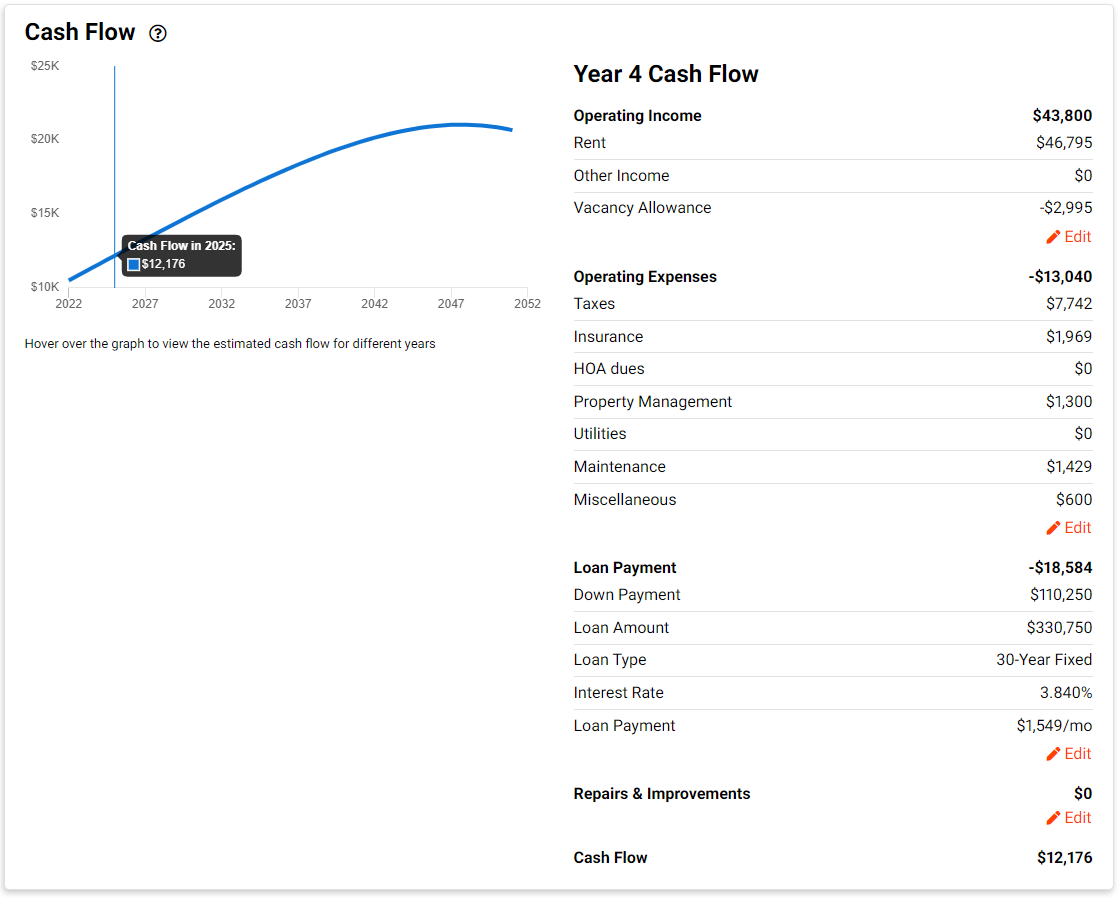
In the Cash Flow section of the property summary report, you’ll see the details of the rental income and the various expense estimates. The Year 1 expenses will include immediate expenses after purchase, like repair costs. You’ll also see a chart plotting estimated cash flows over thirty years using the market assumptions to show the change in cash flow. A positive estimated cash flow number means your property will be profitable, a negative number means it is not – and you’ll see the breakeven point on the chart if there is one. If you hover over a different year in the chart, you’ll see the cash flow details for that year and the tables will update with the cash flow details.
Some rental property calculators only look at a property’s cash flow estimates, but the Padvest evaluation goes deeper and considers property appreciation, or equity growth over time, as part of the comprehensive financial forecast.

Long-term residential real estate investors grow their wealth by having equity appreciation in a property. Equity is the sale price minus the amount remaining on a loan on the property, or the net proceeds of the sale. In the Equity section of the report, you’ll see a chart plotting the estimated appreciation in the price of the property. This includes an estimate of what the property would sell for if you were to put it on the market in that year, and the resulting estimated equity calculated using the purchase price you’ve specified. Where possible, you’ll also see past sale prices for the property. Hovering over the chart will reveal details for each year’s estimated sale price, loan details, and the resulting estimated equity and proceeds on the property.
The income statement section of the property evaluation report contains a table view of the detailed financials for the property shown in 5-year increments. You can quickly see gross operating income, total operating expenses, net operating income, debt service, and the sale price & equity. This section makes it easy to measure the near- or long-term cash flow and appreciation for the property.
The property evaluation report has a share link at the top of the page so you can create a sharable link to a read-only version of the report. You can use this link to share the deal parameters with your broker, or your partners. You can also see all of the properties you’re researching on the reports page where you can view a summary of your reports together to see how the deals compare. On the reports page, you can even see an average for the cap rate, CAGR, cash on cash return and IRR for the properties you’re evaluating.
Investing in real estate requires a clear strategy and informed decision-making. Padvest makes it easy to research and evaluate the potential financial returns of a rental property investment so you can make your investment decisions quickly and with confidence. Read more about Padvest research, sign up and start researching properties today.
We'll reach out to set up a call.